Brands investing in digital billboards without verified location data are wasting budgets, which is why AI DOOH audience targeting India has shifted from a forward-looking experiment to a baseline requirement for modern media planners. The legacy practice of purchasing outdoor media based on vendor relationships is collapsing as buyers demand transaction-linked accountability.
As total advertising expenditure in India approaches the ₹2,01,891 crore mark in 2026, the structural balance of power has tilted decisively toward digital formats. While linear television struggles with flat growth, the physical outdoor advertising sector is expanding through a digital layer that demands verifiable metrics. Marketers are no longer willing to write blank checks for unmeasured physical reach, forcing a structural migration from speculative visibility to precise, outcome-driven placements.
That is the core failure.
How digital out of home targeting AI maps urban audiences
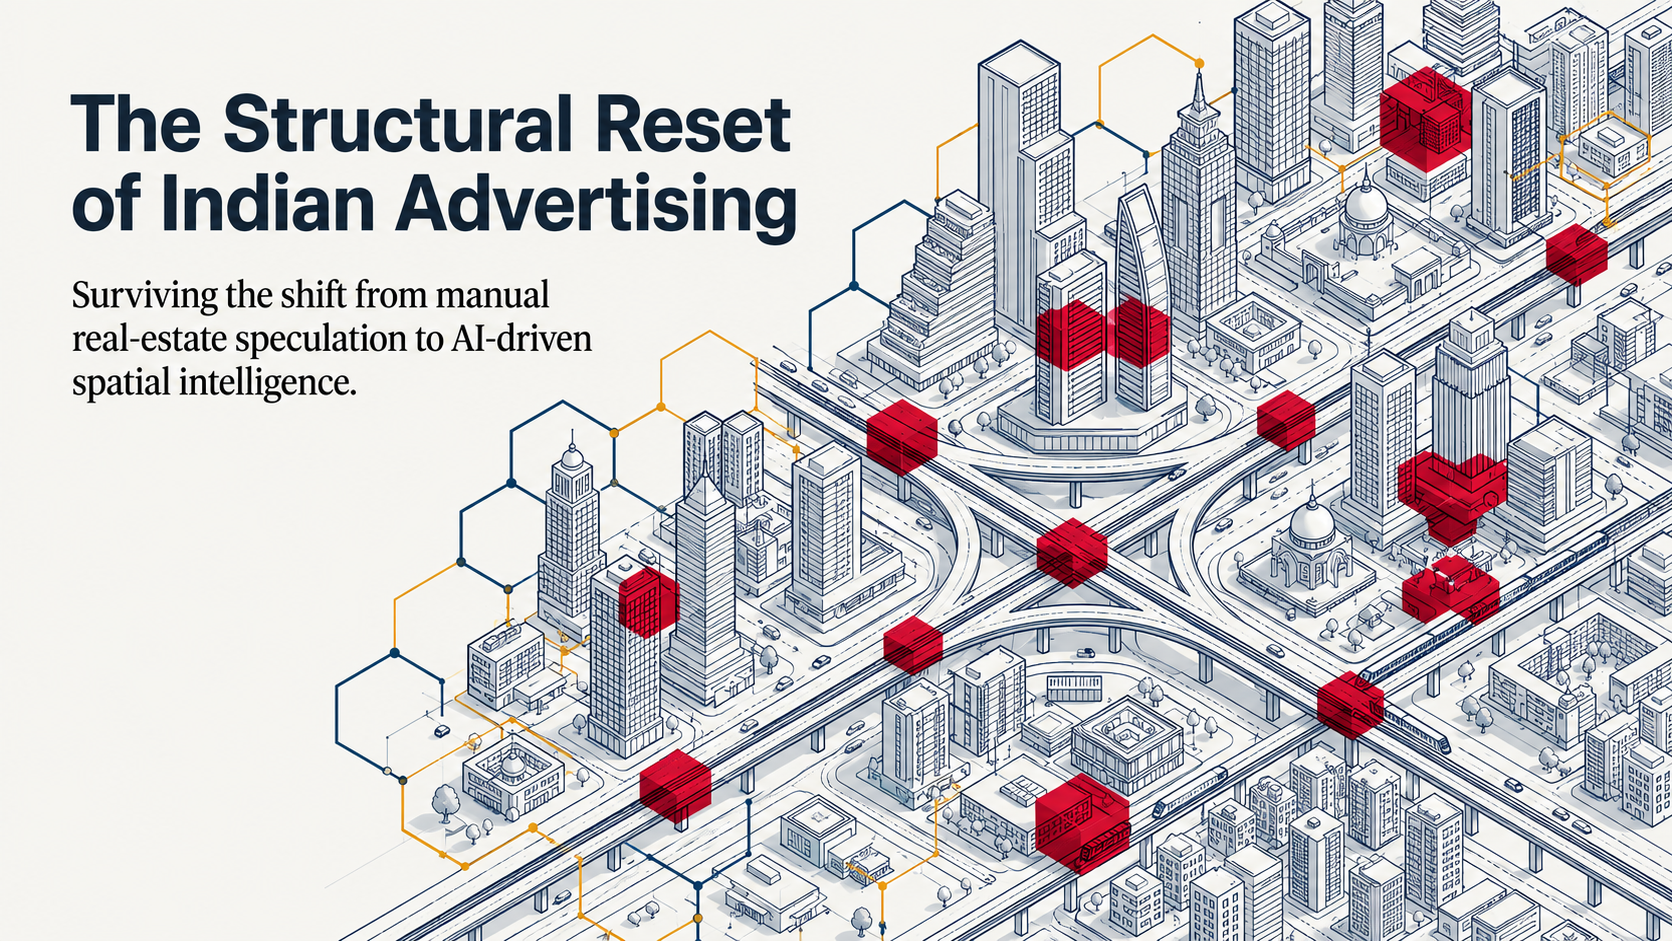
To understand how modern outdoor audience data India is calculated, we must abandon the traditional square-grid mapping that has historically distorted urban mobility. Urban movement does not conform to perfect ninety-degree angles, which makes standard administrative pin codes highly ineffective for spatial analysis. Instead, the technology relies on a hexagonal demand model, carving cities into hexagonal cells with a four-hundred-and-sixty-meter edge length. These hexagons act as distinct behavioral units, aggregating device density, point-of-interest indicators, and real-time footfall patterns.
This spatial intelligence is divided into four structural scoring dimensions to evaluate every specific billboard location. The system calculates audience alignment, repeat-exposure movement conditions, surrounding commercial purchase indicators, and brand-archetype intent fit.
A luxury brand, for instance, requires high-street districts where buying patterns align with affluence signals. Conversely, fast-moving consumer goods require high-density transit paths where cumulative exposure triggers immediate purchases. By analyzing these layers, the platform assigns a clear strategic role to each asset rather than relying on a generic traffic estimate.
Most planners still do not know this.
Why outdoor audience data India plans get rejected by clients
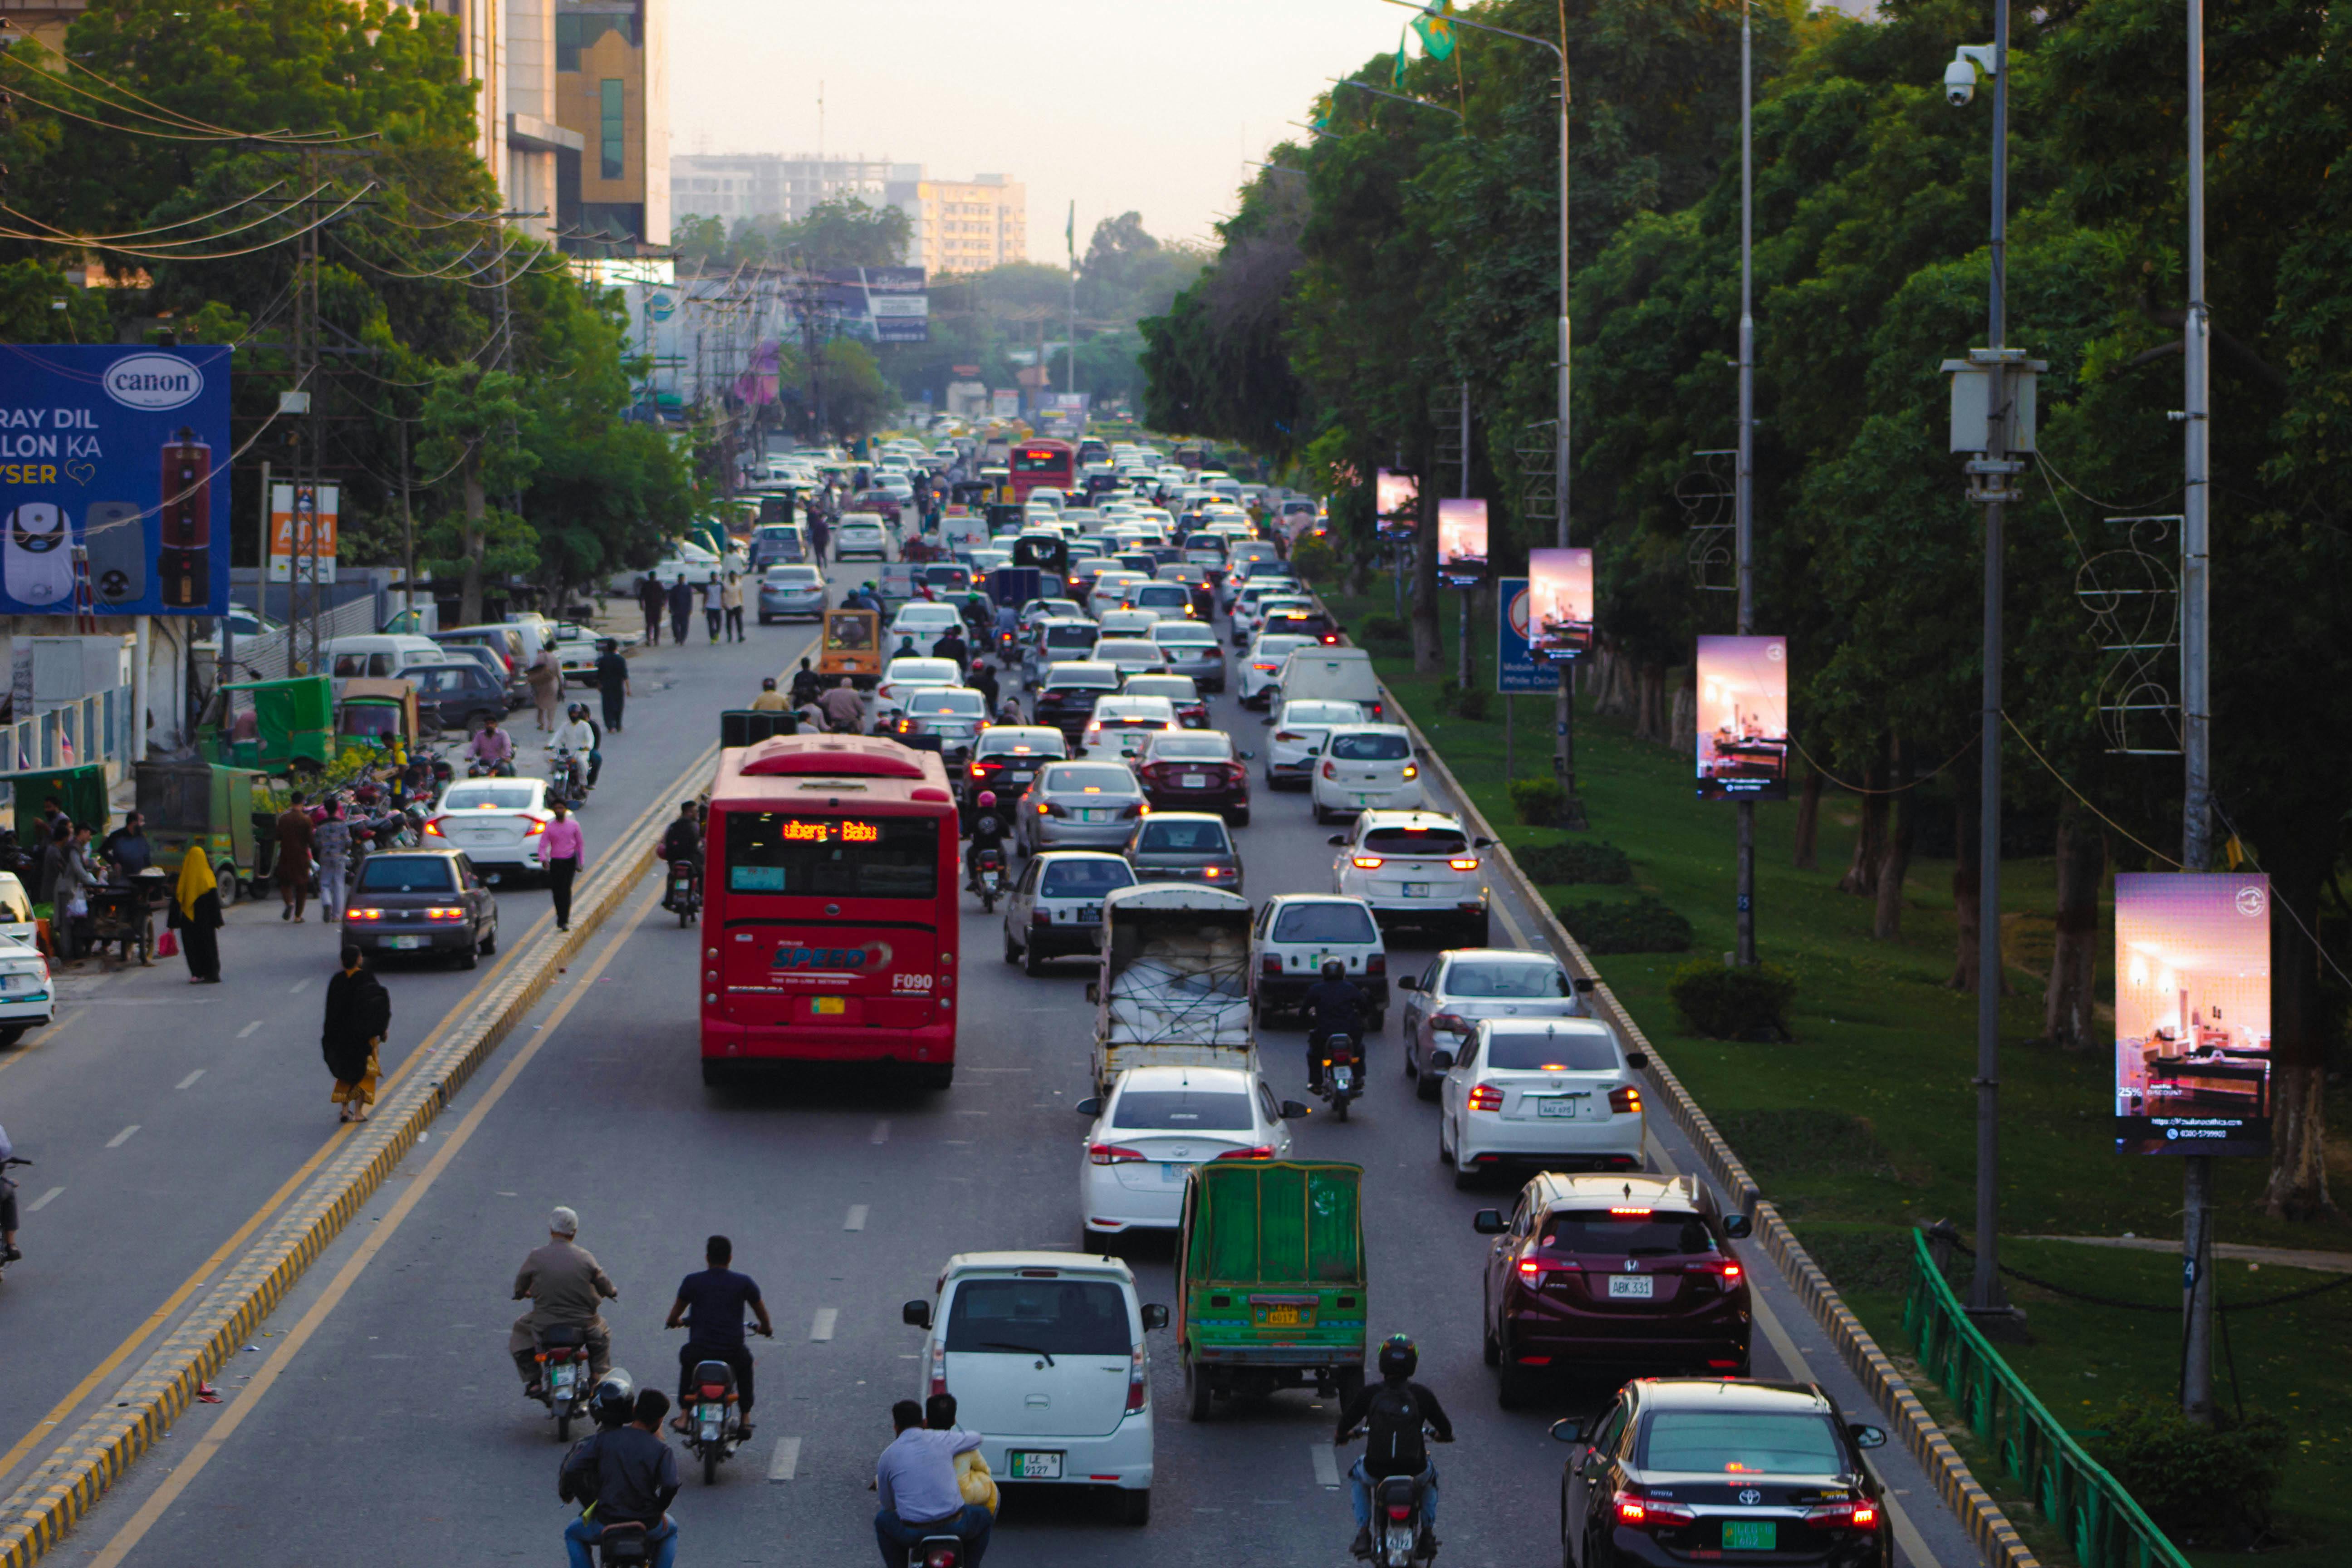
The historic breakdown of physical outdoor advertising occurs during the justification phase, where agency planners present plans built on spreadsheets and vendor conversations. Consider a real scenario on the Western Express Highway Bandra-Andheri stretch in Mumbai, where a financial brand spent ₹8,00,000 per month on a massive gantry. On paper, the site claimed five lakh vehicles daily, yet the campaign failed because the average speed during rush hour dropped to five kilometers per hour. The commuter attention was focused entirely on driving through the bumper-to-bumper congestion rather than looking up at a high-angle gantry.
The client eventually rejected the entire multi-city renewal because the agency could not prove actual audience engagement or store footfall. This lack of auditability creates a massive leak, with an estimated forty percent of traditional outdoor advertising budgets wasted on obstructed, poorly placed, or fast-speed sites.
To be direct about something most platforms will not say, full attribution for a static hoarding in a tier-three city is still genuinely difficult. The data exists, but the ground-truth verification infrastructure in smaller markets is still catching up with metros like Delhi and Bengaluru. Anyone selling you a complete, real-time solution for that specific scenario is oversimplifying the operational reality on the ground.
Nobody talks about this openly.
How smart billboard platform software solves the accountability crisis
Instead of operating as an inventory list or a broker, a modern AI-driven OOH system introduces comparable standards and spatial reasoning. It acts as a decision intelligence engine, meaning that assets inherit their strategic value from the broader urban structures surrounding them. The platform models corridor behavior, understanding that sequence exposure—seeing a brand multiple times along a single commute—produces memory recall that isolated sites cannot match. This shifts the entire buying model from purchasing random available real estate to acquiring targeted attention pools.
We do not sell physical space; we score it based on active behavioral data. When clients first see our hexagonal demand model, their question is almost never about mathematical accuracy, but rather about which specific zones their competitors have left uncovered. That realization changed how we built the platform, moving us from a simple workflow tool to an autonomous location reasoning system.
By replacing subjective agency opinions with verified device density metrics, every allocation becomes entirely defensible. Explore the full platform at adnoxy.com to see how these automated planning loops remove the guesswork from physical media.
Here is the part that usually surprises people.
Hard numbers behind AI DOOH audience targeting India
According to the Pitch Madison Report 2026, the outdoor advertising market in India has reached ₹4,700 crore, growing at a twelve percent annual rate. This expansion is occurring alongside a structural shift where digital out-of-home now accounts for fifteen percent of the total spend. Additionally, research from Nielsen India shows that outdoor ads deliver an eighty-two percent brand recall rate, which is the highest of any media channel. The shift toward AI DOOH audience targeting India is not just an incremental improvement but a fundamental reorganization of how media budgets are justified.
As one media planner put it: "We stopped trusting gut feel the day ADNOXY showed us the data." This sentiment matches findings from MAGNA Intelligence, indicating that AI-driven digital screens increase consumer engagement by up to thirty percent. When physical campaigns are combined with targeted mobile advertising, studies show a forty-eight percent increase in total brand recall.
These performance metrics demonstrate why top-tier advertisers like Tata, Axis Bank, Nivea, and Nestlé are moving their budgets to smart billboard platform systems. A physical placement is no longer a static background option; it is the top-of-funnel trigger that drives online search queries and physical store visits.
Practical strategies for DOOH audience segmentation India
When building a campaign in 2026, planners must structure their physical assets to match the specific behavior of their target demographic. Start by mapping the primary arterial routes, commercial hubs, and high-street zones where your target audience concentrations are highest. Deploy a combination of primary anchor assets to establish brand stature, alongside commute frequency drivers to build repetition. This structured sequencing prevents your physical creative from fading into the urban backdrop as visual wallpaper.
Stop buying raw reach; your campaign does not have a visibility problem, but rather a repetition problem. Most outdoor plans actively damage performance by spreading budgets across disconnected, high-traffic locations that commuters pass only once. To build actual memory recall, you must concentrate your assets along a single corridor to establish cumulative exposure.
Additionally, align your creative rotations with specific day-parts, showing breakfast-relevant copy in the morning and dinner-relevant copy in the evening. This contextual relevance increases the brain response of passersby by over thirty percent, turning a standard impression into an active consideration moment.
And that changes everything about how you plan.
How to evaluate a digital OOH targeting AI solution
To understand the difference between generic projections and verifiable location data, let us examine a real decision scenario involving a premium mobility brand. The marketing team walked into an agency meeting with a mandate to launch a new electric vehicle across Mumbai and Bengaluru. The traditional agency presented a beautiful deck featuring thirty premium hoardings, citing massive traffic estimates and glowing site photographs. The client, however, asked a single question: how many of those daily commuters actually possess the household income to purchase a forty-lakh-rupee vehicle?
The legacy agency had no answer, relying instead on generic socioeconomic classification assumptions. Our team ran the same brief through our spatial intelligence engine, filtering for genuinely affluent residential zones and high-intent corporate corridors. We replaced twelve low-speed, high-speed, and obstructed highway sites with eight strategic corporate signal boards near tech parks and high-street retail zones.
The campaign delivered a thirty-eight percent increase in localized search queries because every single screen was matched to verified household affluence. To assist your team in making these spatial decisions, we have compiled the verified cost and performance benchmarks across the primary media channels below.
| Channel |
CPM Range in INR |
Average Brand Recall |
Skip or Adblock Rate |
| Standard Hoardings |
₹5–₹15 |
82% |
0% |
| Digital Display Ads |
₹50–₹200 |
41% |
65% |
| Social Media Ads |
₹30–₹150 |
38% |
70% |
| Television Ads |
₹100–₹300 |
62% |
25% |
| Programmatic DOOH |
₹500–₹2,000 |
92% |
0% |
Building a defensible outdoor strategy in 2026 requires brands to demand the same level of analytical rigor from physical billboards that they expect from performance digital channels. As the Indian outdoor landscape continues to expand across both metros and tier-two cities, the gap between speculative visibility and verified location data will close entirely. Planners who continue to rely on manual spreadsheets and vendor relationships will find themselves left behind, while those who embrace spatial intelligence will capture a disproportionate share of market attention.
Frequently Asked Questions
How does an AI OOH platform verify actual audience footfall in Indian cities?
Our platform bypasses speculative municipal traffic estimates by integrating anonymized device density data from mobile devices. This permits us to map real-time movement and calculate the true location of commuters passing a screen. We combine these mobility patterns with points of interest to determine the exact demographic profile of a specific junction.
Can a smart billboard platform distinguish between different household income levels?
Yes, ADNOXY uses proprietary quantum profiling to separate genuinely affluent residential areas from commercially expensive or transit-inflated zones. The platform analyzes repeated device movement patterns, mapping where a device spends nights and where it works during the day. This provides a highly accurate affluence index rather than relying on generic neighborhood assumptions.
What is the advantage of using hexagonal cells instead of square grids for spatial planning?
Square grids distort distance calculations because the corners are further from the center than the sides, whereas hexagonal cells provide uniform distances to all neighboring units. This geometric consistency allows our machine learning OOH tool to model urban movement fluidly without spatial errors. Every hexagon acts as a precise behavioral unit containing POI density and target persona alignment.
How does the outdoor AI tool evaluate if a billboard is obstructed?
Our intelligence architecture performs automated visibility audits on over fifty thousand locations across India. The AI evaluates environmental clutter, billboard height, and traffic speeds using computer vision to calculate a precise visibility score. This helps prevent brands from paying premium rates for sites that are physically blocked or passed too quickly for recall.
What role categories does the platform assign to individual billboard assets?
Every asset in our system inherits a strategic role category based on its location context rather than just a raw score. These roles include primary anchors to establish brand stature and commute frequency drivers to build memory repetition. Additionally, corporate signal boards are placed in high-street professional zones to establish credibility among decision-makers.